 40kn Sail Router
Reading the result
What the map, the time axis, the graphs, the report and the routes list tell you.
The status line
The line above Run Router gives the outcome first. Done means the route reached the destination. Anything else, such as No route or Forecast window ended, means it did not, and the line says why.
The map and time axis
The red line is the route, with S at the start and F at the finish. The thin lines are the isochrones, showing how far the boat could get at each step. Where they bunch up, progress is slow. Where they spread out, it’s fast.
Drag the time axis to move the boat along the route and the weather through time. Red marks on the axis show the route’s departure and arrival.
The readout
The box at the top right has two parts:
- The top part shows the position and the forecast at your cursor (or the map’s centre on a touch screen) at the time on the axis, for the layer you have selected. A dash means the forecast has no data for that place or time.
- The Route part shows the distance and duration, and the boat’s numbers at the time on the axis. Tap it to open Route details.
| Label | Meaning |
|---|---|
| TWS / TWD | True wind speed and direction, relative to the water: the wind the polar sails in |
| TWA | True wind angle, off the bow |
| AWS / AWA | Apparent wind speed and angle |
| STW / CTW | Speed and course through the water |
| SOG / COG | Speed and course over the ground, which include the current |
| Eng | This leg is motored, so STW is the engine’s speed |
The readout’s Wind line and the map always show the forecast as published, even if you set Scale wind to for the route.
Route details
Open Route details from the tab at the bottom of the map.
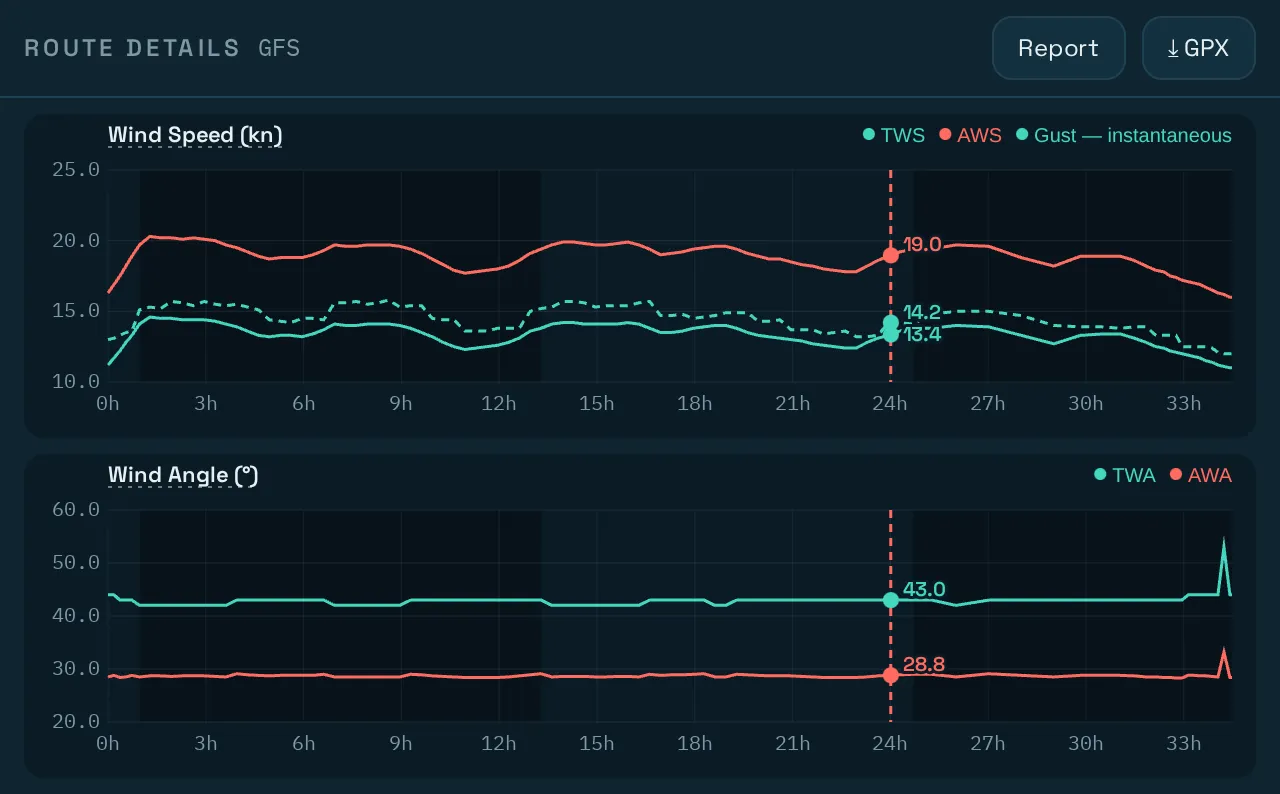
The graphs run from departure on the left, in hours, and shaded bands mark the night. They show wind speed, wind angle, wind direction, boat speed and course. Depending on what the route and forecast include, there are also graphs for gusts, current and waves.
Hover over or tap a graph’s dotted title for a definition of what it shows. Definitions of forecast values come from the forecast itself, because models define them differently. A gust, for example, can be an instant value in one model and a period maximum in another.
Things to look for:
- Strongest wind and gusts: would you be happy in those conditions, in that place, at that time of day?
- Long stretches at a low wind angle: beating for 20 hours is a different passage from the same distance on a reach.
- Waves against the route: the router doesn’t use waves, so you have to judge these yourself.
The report
Report in Route details shows every setting the route used, followed by a table with each step’s time, position, wind, speeds, course and manoeuvre. The abbreviations are explained at the end, and ⤓ .txt saves it as a file.
It’s worth checking when you compare routes or return to one later. It records the forecast run, efficiency, limits, keep-out lines and how much of the route had current data.
GPX export
GPX in Route details saves the route as a file for your chartplotter or navigation app. Check it against a chart there, because the app’s coastline isn’t a chart.
The Routes list
Routes, the third button on the left of the map, lists your runs as a table you can sort.
| Column | Meaning |
|---|---|
| Route | The departure time, or what varies in a comparison |
| nm | Route length |
| h:m | Duration |
| max TWS | Strongest true wind along the route |
| up wind | Share of the time spent beating (true wind angle of 60° or less) |
- Show and compare: tap a row to show or hide that route on the map. Show several at once to compare them.
- Save: the list keeps your last 8 runs, and an older one is deleted when a newer run arrives. To keep a route for good, use Save in the row’s ⋯ menu. The menu also has Export GPX, Show report and Delete.
- Delete: swipe left on a touch screen.
Clear route in Routing setup only hides the routes on the map. They stay in the list.
When you compare, isochrones are drawn only for the primary route: the first one shown.
Routes are stored in the browser on this device. See Install the app for how to protect them.